

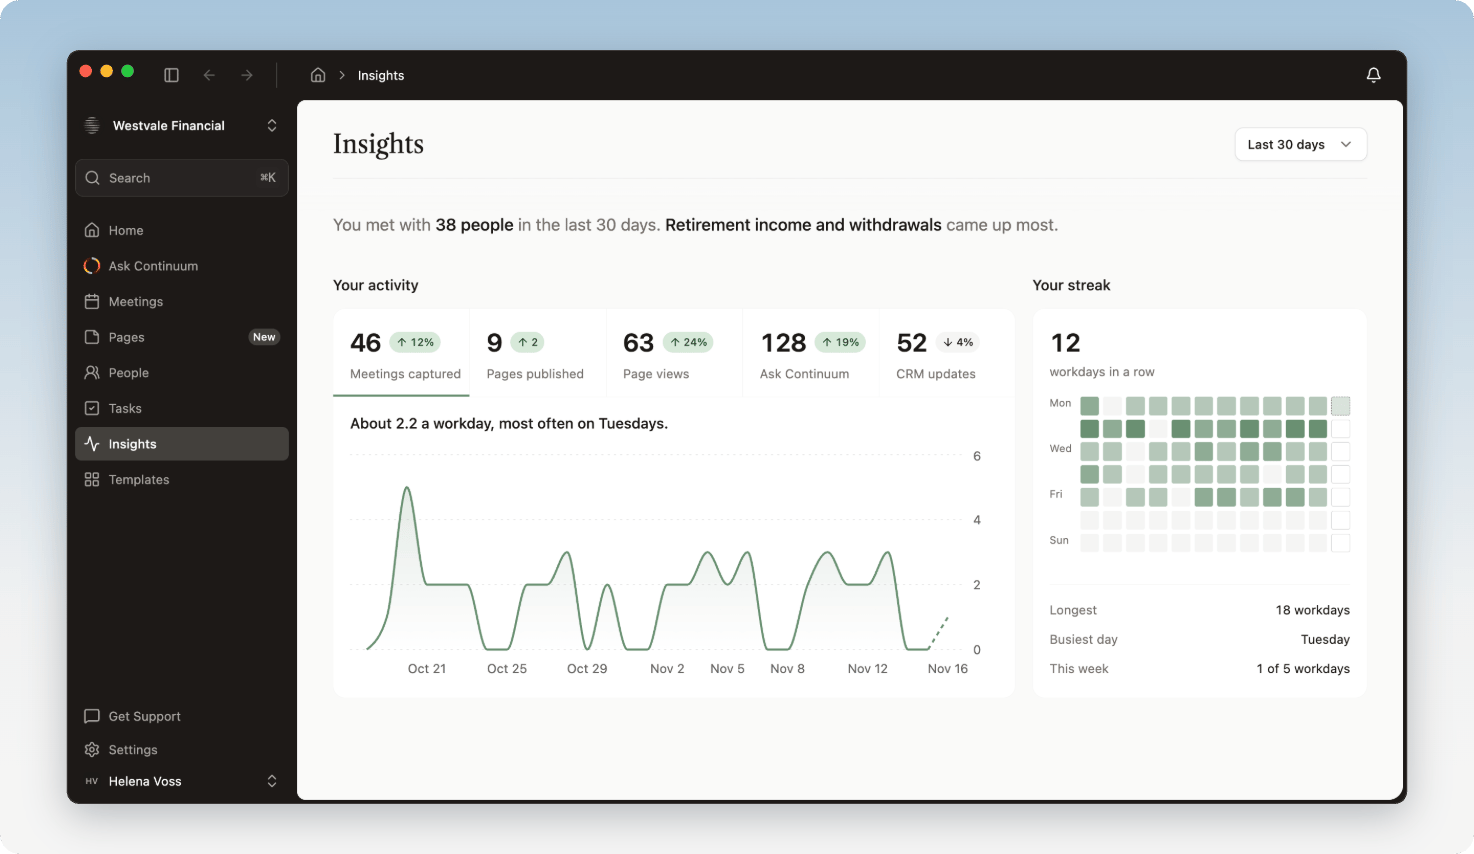
Open Insights
Click Insights in the sidebar. The page counts only your own work: the meetings you own, the Pages you published, and the messages you sent to Continuum, not your teammates’. If you haven’t captured a meeting, published a Page, or asked Continuum a question yet, the page shows No activity yet until you do.Choose a period
Pick the period at the top right of the page: This week, Last week, Last 30 days, or Last 90 days. The page opens on Last 30 days. Every section updates to that period except Your streak, which always looks back 12 weeks. Where a number has an arrow beside it, the arrow compares it with the period of the same length before it. A count that was zero last time shows New. The sentence at the top of the page sums up the period: how many people you met with, and which theme came up most. Each contact on your meetings counts once, however many meetings they were in.Your activity
Your activity shows five counts for the period: Meetings captured, Pages published, Page views (times your clients opened your Pages), Ask Continuum (messages you sent to Continuum), and CRM updates (times Continuum updated your CRM). Click a count to see it on the chart below, with one line of context such as how many a workday you averaged or which day you’re busiest. Pages published and Page views appear only when your organization uses Pages.Your streak
Your streak counts the workdays in a row on which you did something in Continuum: captured a meeting, published a Page, sent Continuum a message, or had Continuum update your CRM. Your clients opening your Pages doesn’t count toward it. Weekends don’t add to your streak or break it. Today doesn’t break it either until the day is over, so a quiet morning won’t reset it. The grid shows the last 12 weeks, one square per day. Below it, Longest is your best streak in that time, Busiest day is the weekday you’re most active, and This week is how many of the five workdays you’ve been active so far.What came up in your meetings
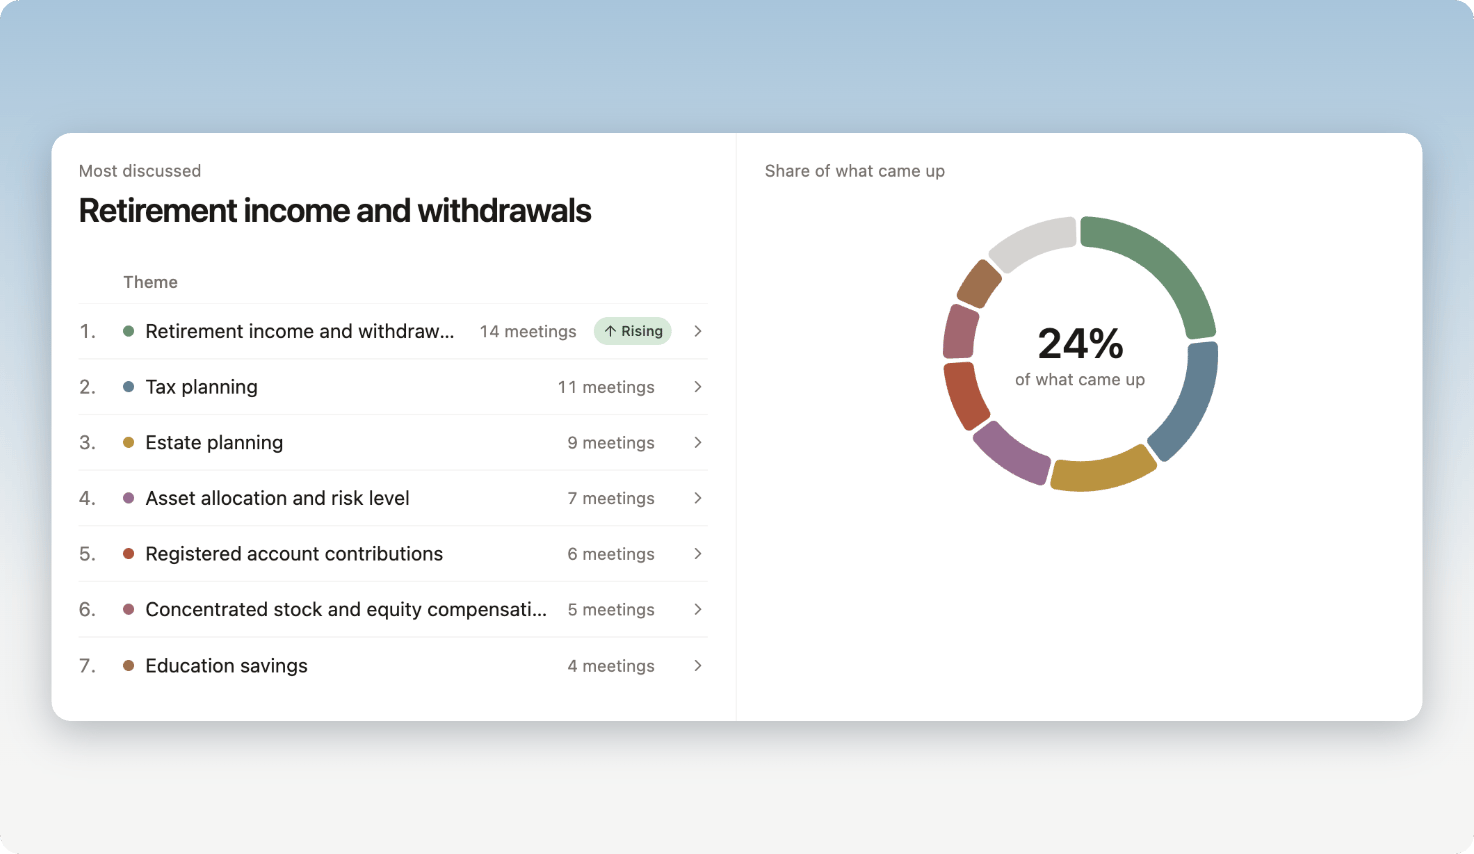
This section groups the subjects discussed in your meetings into themes, such as Tax planning or Estate planning, and ranks them by how many meetings they came up in. Themes come from your meeting summaries, so a meeting counts here once its summary is ready. If you edit a summary, its themes update to match.- Most discussed names the top theme.
- The list shows up to seven themes, each with how many meetings it came up in. For Last 30 days and Last 90 days, the themes after the top one are listed only when they came up in at least two meetings.
- Rising or Easing beside a theme means it came up in noticeably more, or fewer, meetings than in the period before.
- Share of what came up shows how much of what was discussed falls under each theme. Subjects that don’t fit a listed theme are grouped as Other topics.
See the meetings behind a theme
1
Click a theme in the list
A panel opens on the right with every meeting in the period where that theme came up, newest first.
2
Read what was discussed
Under each meeting, Continuum lists the points from its summary that fall under the theme.
3
Open a meeting
Click a meeting to open it.
Your Pages
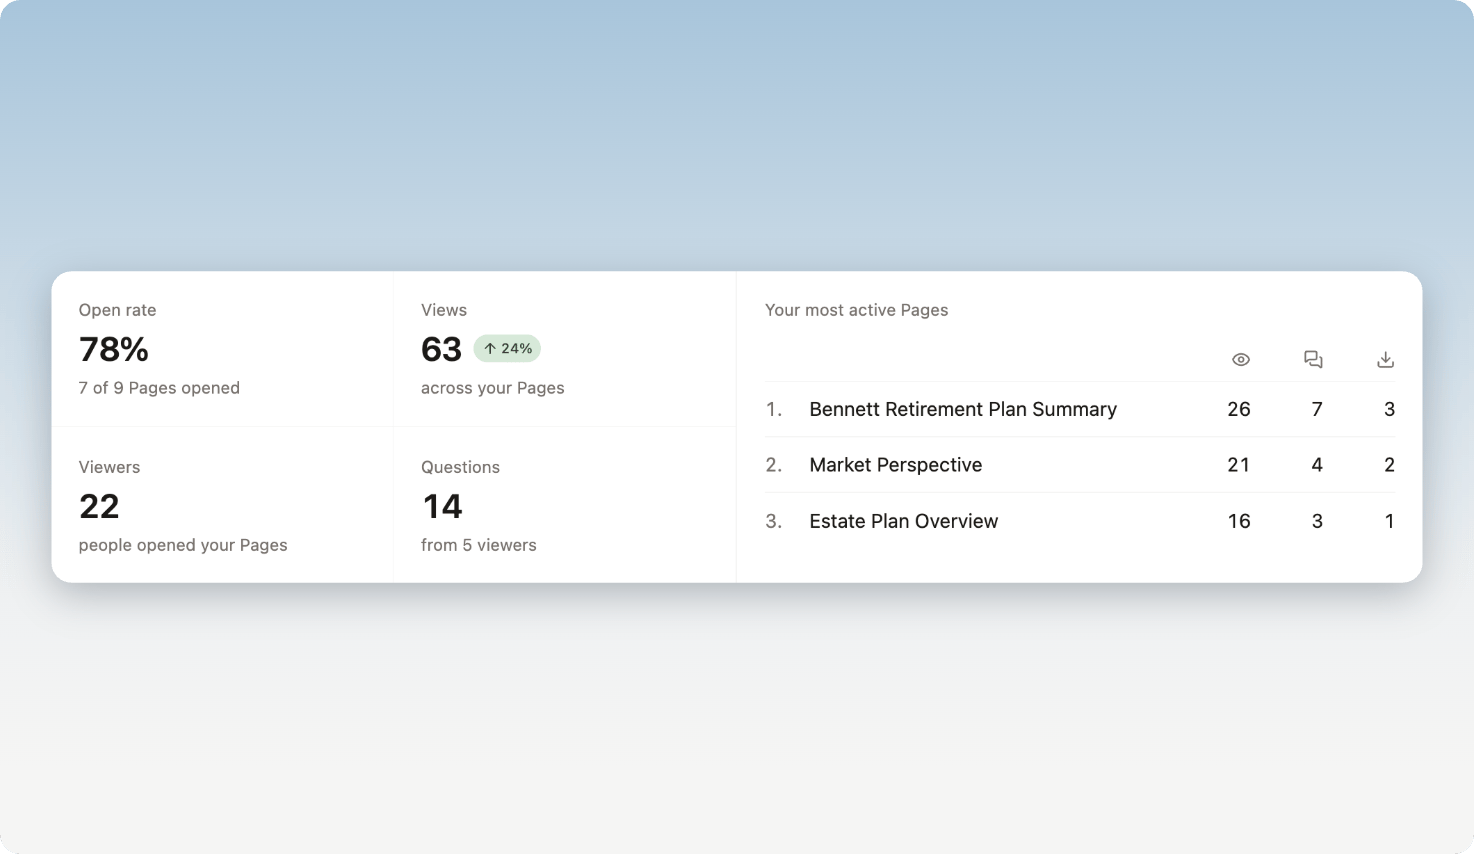
Your Pages shows how clients are engaging with the Pages you published. It appears only when your organization uses Pages.
Your most active Pages ranks your Pages by views, questions, and downloads in the period. Click a Page to open its details, including its Activity. See Track engagement.
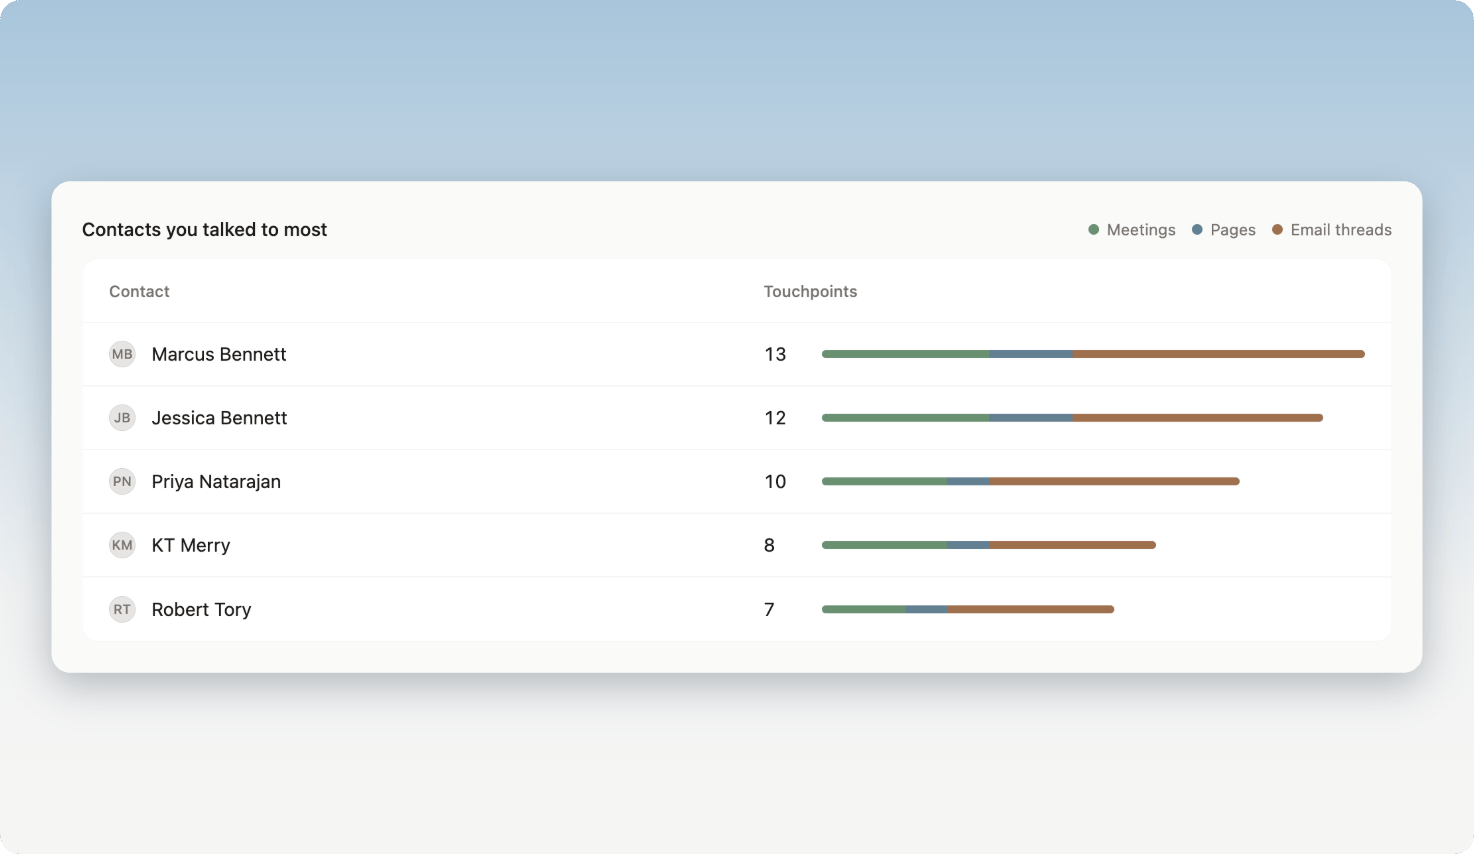
Contacts you talked to most
This section lists the five contacts you had the most touchpoints with in the period. Each touchpoint is one of:- Meetings: a meeting of yours they were on
- Pages: a Page you published for them
- Email threads: an email thread with them, when you’ve connected an email account in Google or Microsoft
Limitations
- Insights isn’t in the mobile app.
- Only meetings you own count. A meeting a teammate captured, where you were a participant, counts on their Insights, not yours.
- If What came up in your meetings says there aren’t enough meetings yet, none of your meetings in the period has a summary with themes yet. Pick a longer period, or check back once your next meeting’s summary is ready.
- If a section shows Couldn’t load this section, pick another period or refresh the page.
FAQ
Why is a client missing from Contacts you talked to most?
Why is a client missing from Contacts you talked to most?
The list shows only the top five for the period, counting meetings and Pages, plus email threads when an email account is connected. Pick a longer period to include more of your work.
Can I change the theme names?
Can I change the theme names?
No. Continuum uses one set of themes for every organization, and points from a summary that don’t fit one are grouped as Other topics.